Development and functioning of ice-wedge polygon mires in Arctic NE Siberia
The Arctic is subject to major environmental change resulting from global warming, which proceeds considerably faster than the worldwide average. The northern circumpolar permafrost region includes around 50% of the estimated global soil carbon pool, being equivalent to twice the current atmospheric content. The melting of permafrost will probably trigger substantial greenhouse gas emissions, which can feedback on further global warming. It is at present not yet thoroughly understood how Arctic mires developed in the past, and how they will develop in the future. High-resolution palaeoecological studies may help to unravel the processes that contribute to the formation and functioning of permafrost peatlands.
Ice-wedge polygon mires are typical landscape-elements of the Arctic, and cover c. 250,000 km2, i.e. around 3% of the total arctic land mass (Minke et al. 2007).
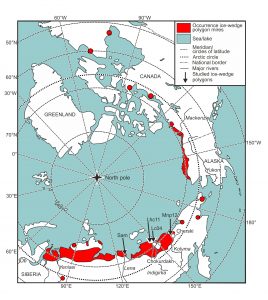 Circumpolar distribution of ice-wedge polygon mires and location of the study areas
Development of Arctic ice-wedge polygons
Ice-wedge polygons develop as a result of frost cracking and ice-wedge growth under permafrost conditions: initial frost cracks of a few millimetre widths develop during the Arctic winter, fill with water in spring that immediately freezes to form ice veins. Renewed frost contraction causes a new crack to originate in a following winter, which again fills with water that freezes. Wide ice-wedges develop after centuries of perpetual repetition of these processes. Every summer the frozen soil between the wedges, which had contracted in winter because of lower temperatures, expands again but finds its former extent occupied by the newly developed ice wedge. As a result, soil material is pushed-up against the ice wedges to form ridges of several decimetre heights surrounding depressions with a diameter of 10-30 m. Such polygons are called ‘low-centre polygons’, in contrast to ‘high centre polygons’ which result from (partial) thawing of the ice wedges, collapse of the ridges and consequent relief inversion.
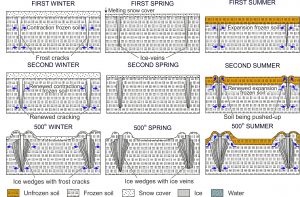 Development of ice-wedge polygons in the course of time. From De Klerk et al. (2018)
The vegetation of the dry polygon ridges differs distinctly from that of the low-lying depressions and polygon troughs. Typical ridge plants are Betula exilis, Ericales, Eriophorum, Rubus chamaemorus and the moss taxa Aulacomnium, and Dicranum; the low-lying microtopographic elements contain mainly Carex chordorrhiza, Pedicularis, Comarum, and the moss Scorpidium revolvens (Minke et al. 2009). Peat formation, accordingly, is different at high and low elevated spots, and the polygons are characterised by a short-distance mosaic of different mire habitats.
Short-distance pollen surface samples studies
To study the relation between pollen deposition and actual vegetation (mapped for plots of 1 m2) palynological surface samples were analysed along transects through the studied polygons with distances of 1 m (De Klerk et al. 2009, 2014, 2017). The range of enlarged pollen deposition (local and extralocal pollen deposition trajectory) is restricted to only 1 or 2 metres which is attributed to the generally low growth forms of the flora (not exceeding 20 cm). There is a clear connection between vegetation patterns, pollen deposition and microtopography, which shows that palynological studies of peat profiles enable the detection of previous dry or wet phases, i.e. the existence of a local ridge or a depression/trough setting. High pollen/spore deposition of the most important plant taxa (Salix, Betula, Ericales, Cyperaceae, Comarum, Rubus, Sphagnum) normally occurs at only few plots. This means that only one or few specimens of the total population obtain optimal flowering or pollen production. This illustrates the complex relationship between plants, flowers and flowering, and pollen production, pollen dispersal and pollen deposition. The testate amoeba taxa Assulina, Amphitrema and Arcella occur at the higher polygon ridges, whereas algae of the Zygnemataceae family occur in the moist polygon centre and in a deep throughs. Since C/N-values are also closely related to the surface elevations, the distribution patterns of the testate amoebae might also relate to trophic conditions.
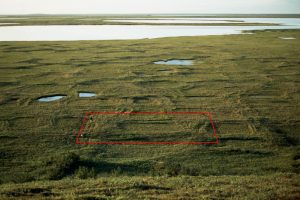 Ice-wedge polygon complex near Chokurdakh, view from a yedoma plateau to a nearby lake, with the studied polygon Lc04 marked (photograph: Hans Joosten)
Palaeocology of ice-wedge polygons
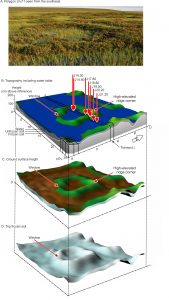
Hitherto it was thought that ice-wedge polygons are hydrologically closed systems, but recently it was discovered that in the top of the frozen soil deeply thawed spots exist that allow subsurface drainage of water. These ‘hydrological windows’ (Minke et al. 2007; Donner et al. 2012) regulate internal polygon hydrology. They originate from meltwater flowing along the frozen ground in summer, and thus protect the frozen ridges against thermal erosion and thawing the soil ice at the initially lowing-lying spots. The windows cause a lowering of the water table in the depression that otherwise would occur under influence from the heat-storing water body.
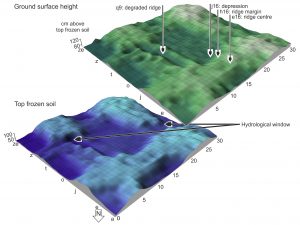 Three-dimensional model of low-centred ice-wedge polygon Lc04 at Chokurdakh with the locations of the analysed peat profiles and the hydrological windows. 3D-model created by Merten Minke and modified by Pim de Klerk. From De Klerk et al. (2018)
We analysed four peat profiles from a low-centre ice-wedge polygon (Lc04) near Chokurdakh along the Indigirka River (De Klerk et al. 2011), covering the depression, the centre and margin of a ridge, and a collapsed ridge. The analyses show a succession of wet and dry phases. Dating uncertainties prohibit a sharp chronology, but time ranges within which changes must have occurred could be identified. The complex chronology of ridge-centre profile e16 even provides three possible chronological interpretations. A comparison with palaeo-temperatures allows the climatic characterization of the various phases.
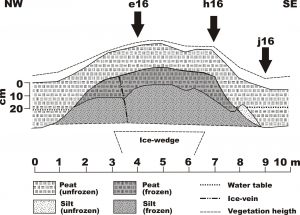 Cross-section through the northwestern polygon ridge of polygon Lc04 near Chokurdakh along the Indigirka River with the locations of the palaeoecologically studied sections e16, h16, and j19. From De Klerk et al. (2011)
Clastic sediments underlie the peat, and the wet peatland phases at the base of the analysed sections represent terrestrialisation along the margins of a thermokarst lake, which started between ca. 800-1000 CE. Between c. 1200 and 1400 CE a dry phase in the polygon depression (j16) probably represents a local frost bump, which degenerated by thermal erosion in the closed depression after mature ridges had developed around 1400 CE.
The development of the mature ridges after 1400 CE corresponds in time with a phase of relatively high temperatures. Higher temperatures probably dried the moss and uppermost peat layer in the elevated polygon elements in summer, enhanced insulation and prevented heat to enter. In winter the insulating snow layer was thinner on the – now rewetted – more exposed elevations, allowing cold to penetrate better. The colder elevations could attract more water and grow upwards in a positive feedback of segregation ice development and development of better insulating vegetation and peat. During the cold phase between 1600 and 1800 CE (later part of the Little Ice Age) the ridges sustained themselves.
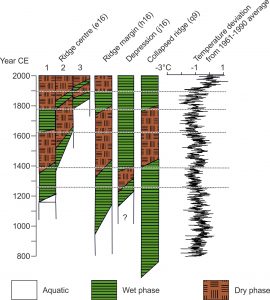 Dry and wet phases in the peat profiles of polygon Lc04 near Chokurdakh along the Indigirka River compared to PanArctic palaeo-temperature (data from https://www.ncdc.noaa.gov/paleo-search/study/14188). From De Klerk et al. (2018)
In the first half of the 19th century the ridges at q9 and h16 degraded/collapsed, when a short somewhat warmer phase was succeeded by a sudden climatic cooling. Ridge degradation probably was very rapid as the abrupt changes in palaeovegetation illustrate. Also at present such changes may occur rapidly: we observed in polygon Lc04 a complete disappearance of the northwestern ridge between 2004 and 2011. We assume that the ice-wedge, which penetrates deep into the frozen soil, will have remained largely intact, and only the pushed-up ridge above the wedge will have degraded. The simultaneous collapse of (parts of) two different ridges (q9 and h16) indicates a high water level in the depression as cause of ridge degradation. The q9 ridge cannot have been completely perforated simultaneously and no hydrological windows will have been present, since otherwise the h16-ridge would have remained intact. First when around 1900 CE a window had opened or the q9 ridge had degraded completely, water was drained from the depression and the ridge at h16 could regenerate. The rapid regeneration of the ridge (within only a few years) will have been caused by a positive feedback mechanism involving the formation of segregation ice and the re-development of dry ridge vegetation with its insulating properties.
Polygon Lhc 11
In polygon Lhc11 near the research station Kytalyk along the Berelekh River, 1 m distance pollen surface samples were taken along transect j (De Klerk et al. 2016) as well as 7 peat profiles covering the polygon centre, the polygon ridge and the trough.
Polygon Lhc11 near the research station Kytalyk along the Berelekh River, with the surface sample transect j; (3D-model designed by Martin Schrön and modified by P. de Klerk).
The polygon ridge migrated inwards from its original position, where now the trough is located. Pollen analyses of the 7 peat profiles show a pronounced change from wet to dry conditions that illustrate the formation and expansion of the eastern polygon ridge. The collapse of the ridge at j20.20 and j21.10 occurred rapidly relatively “recent”, and it is tempting to interpret a connection with mid/late 20th century climate warming, but this is not yet confirmed. Section j18.80 has been analysed on pollen, macrofossils, testate amoebae and geochemistry and show changes in hydrological conditions in great detail (Teltewskoi et al. 2016).
Polygon complex Mnp 12
Polygon complex Mnp12 near Pokhodsk along the Kolyma River seems to consist of 6-8 individual former polgyons with degraded ridges. Pollen surface samples were studied along transect Y (De Klerk et al. 2017). 5 peat profiles have been excavated from strategically selected spots at and immediately adjacent to the outer rim, and in the large depression of the complex (Behrens et al. 2016). The preliminary results shows that also here the ridges degenerated and partly regenerated.
Polygon MNP12 near Pokhodsk, with the surface sample transect Y and 5 peat profiles; (3D-model designed by Martin Schrön and modified by P. de Klerk). From Behrens et al. (2016)
Samoylov Island
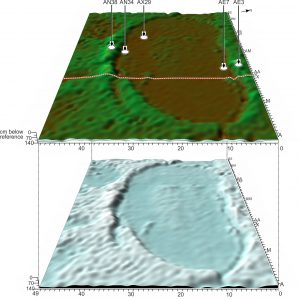
On Samoylov Island (Lena Delta), a transect of 11 adjacent polygons was investigated on surface height, water table and frost table (Minke & Kirschke 2007). Detailed vegetation relevees are available for a reach of 125 m across polygons 4-11, for which surface pollen samples (distance 1 m) were analysed. Three short peat profiles of polygon 7 and the ridge separating polygons 6 and 7 have been investigated for the reconstruction of the polygon development. The research has not yet been published.
![]() Location of “transect 2” on Samoylov Island (Lena Delta) crossing 11 adjacent low-centre ice-wedge polygons. From J. Boike et al. at http://doi.pangaea.de/10.1594/PANGAEA.847343 modified by Pim de Klerk
Location of “transect 2” on Samoylov Island (Lena Delta) crossing 11 adjacent low-centre ice-wedge polygons. From J. Boike et al. at http://doi.pangaea.de/10.1594/PANGAEA.847343 modified by Pim de Klerk
![]()
“Transect 2” on Samoylov Island crossing 11 adjacent low-centre ice-wedge polygons. Pollen surface samples have been analysed for polygons 4-11; three peat profiles have been studied (black arrows).
Outlook
Climate is the major and direct regulating factor of most landforms in the Arctic. Polygon mire dynamics, however, are regulated by a complex interplay of external and internal forcing, direct and indirect effects, and positive and negative feedback mechanisms, affecting frost and thaw processes, hydrology, vegetation development, and peat accumulation. This makes it difficult to predict in detail how polygon mires – or Arctic mires in general – will react to global warming. Initially an increase of polygon development may be conceivable, especially when warming is accompanied by reduced summer precipitation. However, increases in winter precipitation and a related thicker insulating snow cover, earlier snow melt and a longer summer will result in more meltwater input in the polygons, eventually causing the partial or complete collapse of polygon ridges and – as permafrost thawing progresses – also of the underlying ice-wedges.
The study of the polygons along the lower Indigirka River, the Lena Delta, the Berelekh River, and the lower Kolyma River points at conspicuous differences in development, which strengthens the view that local factors are main drivers of polygon dynamics, that these factors react differently under different environmental settings, and that polygon mires have individual, rather than identical characteristics.
Publications:
Beermann, F., Teltewskoi, A., Fiencke, C., Pfeiffer, E.-M. & Kutzbach, L. (2015): Stoichiometric analysis of nutrient availability (N, P, K) within soils of polygonal tundra. Biogeochemistry 122: 211-227.
Behrens, E., De Klerk, P. & Joosten, H. (2016): Records from the collapsed polygon complex MNP12 for actuo- and palaeoecological studies. In: Schirrmeister, L., Pestryakova, L., Schneider, A. & Wetterich, S. (eds.): Studies of polygons in Siberia and Svalbard. Berichte zur Polar- und Meeresforschung / Reports on Polar and Marine Research 697: 49-54.
De Klerk, P., Donner, N., Joosten, H., Karpov, N.S., Minke, M., Seifert, N. & Theuerkauf, M. (2009.): Vegetation patterns, recent pollen deposition and distribution of non-pollen palynomoprhs in a polygon mire near Chokurdakh (NE Yakutia, NE Siberia). Boreas 38: 39-58.
De Klerk, P., Donner, N., Karpov, N.S., Minke, M. & Joosten, H. (2011): Short-term dynamics of a low-centred ice wedge polygon near Chokurdakh (NE Yakutia, NE Siberia) and climate change during the last ca. 1250 years. Quaternary Science Reviews 30: 3013-3031.
De Klerk, P., Teltewskoi, A., Theuerkauf, M. & Joosten, H. (2014): Vegetation patterns, pollen deposition and distribution of non-pollen palynomorphs in an ice-wedge polygon near Kytalyk (NE Siberia), with some remarks on Arctic pollen morphology. Polar Biology 37: 1393-1412.
De Klerk, P., Theuerkauf, M. & Joosten, H. (2017): Vegetation, recent pollen deposition, and distribution of some non-pollen palynomorphs in a degrading ice-wedge polygon mire complex near Pokhodsk (NE Siberia), including size-frequency analyses of pollen attributable to Betula. Review of Palaeobotany and Palynology 238: 122-143.
De Klerk, P., Donner, N., Minke, M. & Joosten, H. (2018): Comprehending the arctic ice-wedge polygon mire landscape using short-distance high resolution palaeoecological research. In: Sychev, V.G. & Mueller, L. (eds): Novel methods and results of landscape research in Europe, Central Asia and Siberia. Volume 1: Landscapes in the 21th century: status analyses, basic processes and research concepts. Russian Academy of Sciences FSBSI “All-Russian research institute of Agrochemistry named after D.N. Pryanishnikov”: 257-262. doi: 10.25680/6112.2018.76.43.048257-262.
De Klerk, P., Bobrov, A., Theuerkauf, M. & Joosten, H. (2020): Short-distance distribution patterns of testate amoebae in an arctic ice-wedge polygon mire (Berelekh-Indigirka lowlands, NE Siberia). Polar Biology 43: 1321-1340. doi: 10.1007/s00300-020-02711-5.
Donner, N., Minke, M., de Klerk, P., Sofronov, R. & Joosten, H. (2012): Patterns in polygon mires in north-eastern Yakutia, Siberia: the role of vegetation and water. The Finnish Environment 38: 19-30.
Minke, M. & Kirschke, S. (2007): Satellite images and ground measured reflectance spectra, thaw depth, soil moisture and vegetation type for characterizing permafrost regions. In: Boike, J., Bolshiyanov, D.Yu. & Grigoriev, M.N. (eds.): Russian-German Cooperation SYSTEM LAPTEV SEA: The expedition LENA 2006. Berichte Zur Polar- und Meeresforschung / Reports on Polar and Marine Research 566: 17-21.
Minke, M., Donner, N., Karpov, N.S., de Klerk, P. & Joosten, H. (2007): Distribution, diversity, development and dynamics of polygon mires: examples from Northeast Yakutia (Siberia). Peatlands International 2007(1): 36-40.
Minke, M., Donner, N., Karpov, N.S., Seifert, N. & Joosten, H. (2007): A window to the soul: biotic/abiotic feedback mechanisms in polygon mire ecosystems. In: Influence of climatic and ecological changes on permafrost ecosystems. Proceedings of the third international conference “The role of permafrost ecosystems in global climate change”. YSC Publishing House SB RAS, Yakutsk: 115-121.
Minke, M., Donner, N., De Klerk, P., Karpov, N.S., Sofronov, R.R. & Joosten, H. (2008): Spatial and temporal variation in carbon accumulation in a Northeast Siberian arctic polygon mire over the last millennium. Geophysical Research Abstracts 10: EGU2008-A-07425.
Minke, M., Donner, N., Karpov, N.S., De Klerk, P. & Joosten, H. (2009): Patterns in vegetation composition, surface height and thaw depth in polygon mires in the Yakutian Arctic (NE Siberia): a microtopographical characterization of the active layer. Permafrost and Periglacial Processes 20: 357-368.
Teltewskoi A, Seyfert J, & Joosten, H. (2012): Records from the model polygon Lhc-11 for modern and palaeoecological studies. In: Schirrmeister, L., Pestryakova, L, Wetterich, S. & Tumskoy, V. (eds.) (2012): Joint Russian-German Polygon Project East Siberia 2011 – 2014: The expedition Kytalyk 2011. Berichte zur Polar- und Meeresforschung / Reports on Polar and Marine Research 653: 51-60.
Teltewskoi, A., Beermann, F., Beil, I., Bobrov, A., De Klerk, P., Lorenz, S., Lüder, A., Michaelis, D. & Joosten, H. (2016): 4000 years of changing wetness in a permafrost polygon peatland (Kytalyk, NE Siberia): a comparative high-resolution multi-proxy study. Permafrost and Periglacial Processes 27: 76-95.
Your e-mail address will not be published.